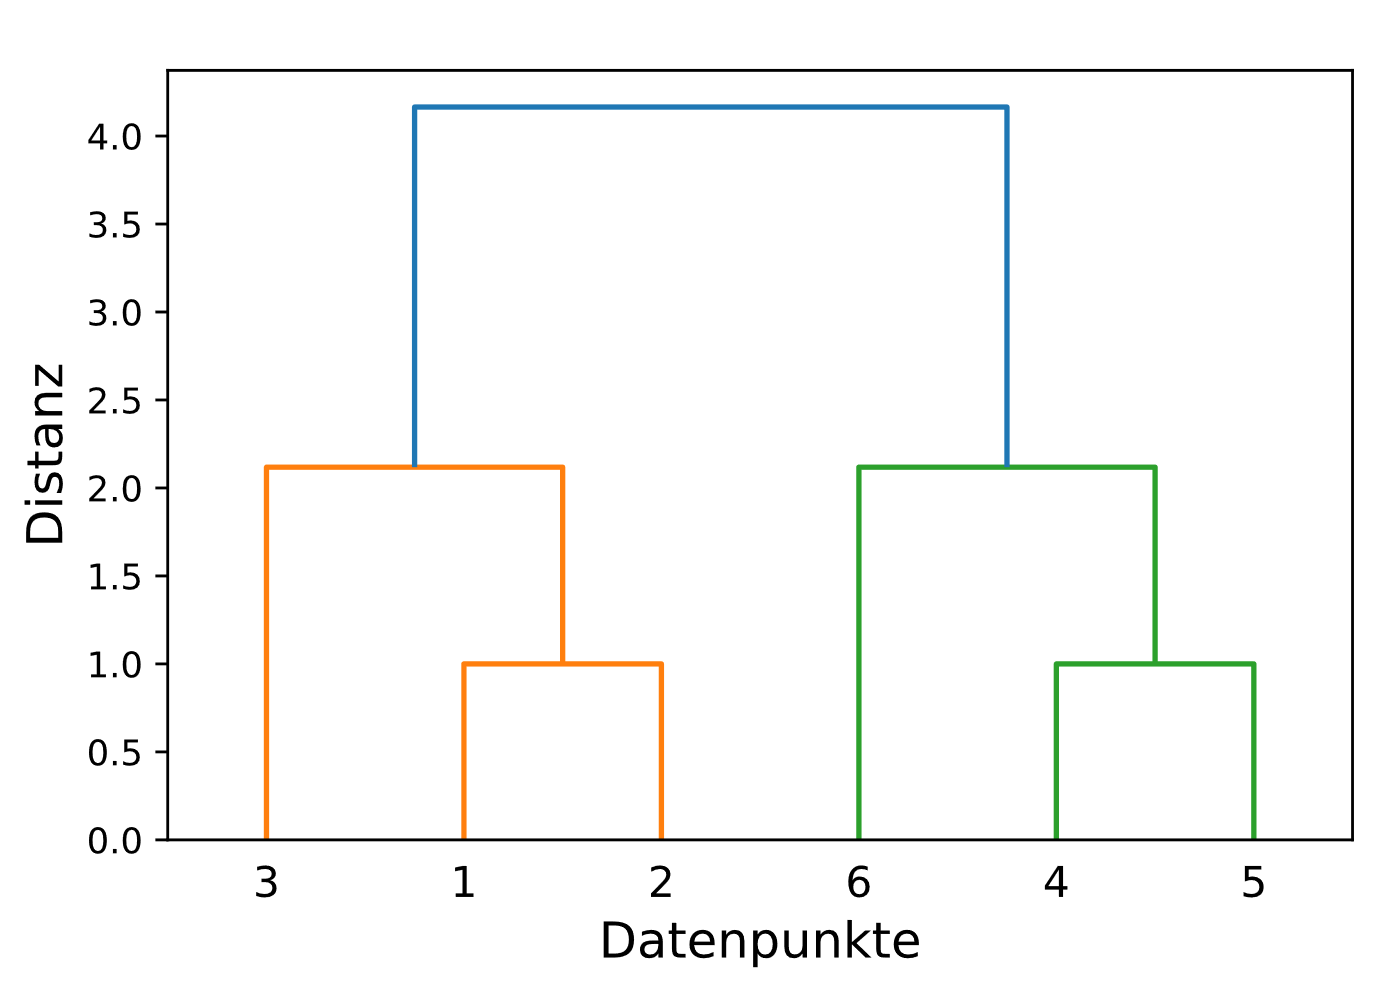
Als quantitatives Dendrogramm bezeichnen wir eine Darstellung von , bei der die Distanz der einzelnen Knoten und die Schwellwerte wie folgt dargestellt werden:
Anmerkung
Quantitatives Dendrogramm mit scikit-learn
In Python erhalten wir ein quantitatives Dendrogramm durch:
def plot_dendrogram(model, **kwargs): # Create linkage matrix and then plot the dendrogram # create the counts of samples under each node counts = np.zeros(model.children_.shape[0]) n_samples = len(model.labels_) for i, merge in enumerate(model.children_): current_count = 0 for child_idx in merge: if child_idx < n_samples: current_count += 1 # leaf node else: current_count += counts[child_idx - n_samples] counts[i] = current_count distance = np.arange(model.children_.shape[0]) linkage_matrix = np.column_stack([model.children_, distance, counts]).astype(float) # Plot the corresponding dendrogram dendrogram(linkage_matrix, **kwargs)model = AgglomerativeClustering(n_clusters=5, linkage="single").fit(E)plot_dendrogram(model)